Imagine that you are a manufacturer who is about to start making widgets. Wouldn’t it be great to know before you commenced production, what the market demand is for that type of widget? Expanding on that concept even further, imagine if you were going to open up a suburban outlet to sell these new widgets. Wouldn’t it be great to know what is the market demand for the widget, in the actual suburb your store could located?
This example is basically the same for property investors and the relationship with the tenant marketplace. And fortunately for us this insight data already exists and is updated each quarter to provide the most timely insights. It’s called, vacancy rate.
What are vacancy rates?

‘Vacancy rate’ is defined by SQM Research as a % of overall rental properties that are ‘listings that have been advertised for 3+ weeks (and are still currently advertised as at the time of collation)‘. SQM Research is an independent property advisory and forecasting research house which specialises in providing accurate property related advice, research and data to financial institutions, property developers and real estate investors. Based in Sydney they are widely regarded as the leading authority on vacancy data, providing analysis at state, city and suburb level of the volume of available rental properties and resulting vacancy rate %. Available free of charge from the SQM Research website, the data equips investors with arguably the most important insight into their property’s ability to secure rental income.
Why is vacancy data useful?
The vacancy rate essentially describes how much competition is in the market for rental properties. It provides a strong indicator of what demand there will be for an investment property, and whether a certain locality will likely have difficulty finding tenants. A vacancy rate of 3% is considered ‘healthy’ as it’s considered the equilibrium point at which the market is evenly balanced between landlords and renters.
A very low vacancy rate below 2% signifies high rental demand, requiring new properties on the market to fuel this tenant requirement. On the other hand, a high vacancy rate above 4% shows the market has more stock available than is required by the tenant pool interested in that suburb.
For investors, a low vacancy rate environment is ideal to operate within as it may provide the following benefits:
- Potential greater selection of applicants and therefore greater chance of being able to select a quality tenant
- Potential for increased rental rate as the tenant market competes for limited properties and will not be turned off by higher rates
- Less fellow landlords competing for the ‘business’ of the available tenant pool
Vacancy rate comparison
The graphs below show the vacancy rates for the last 10 years in the cities of Melbourne, Sydney and Perth. Looking into their history and current trending gives an excellent indication of the rental marketplace.
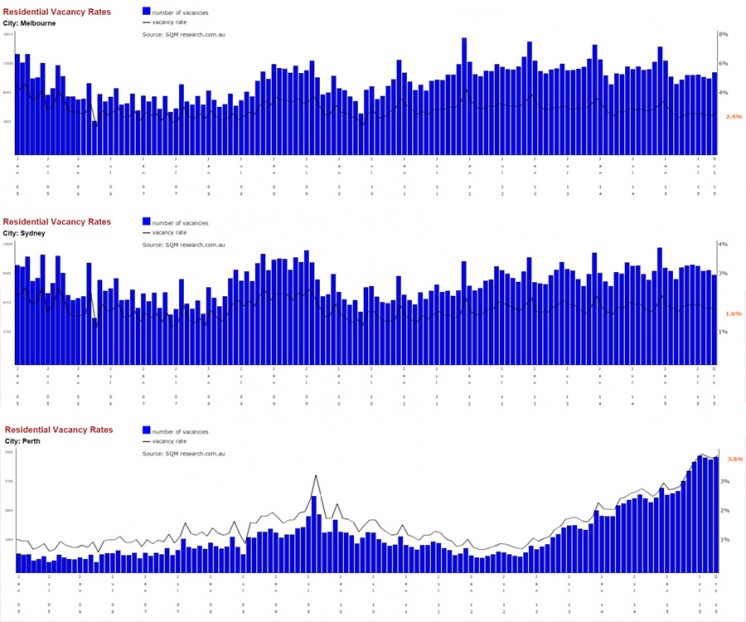
- Melbourne has enjoyed a typically low, stable vacancy rate, working with 2-4% and gradually declining to below 3% this year.
- Sydney has likewise received strong rental demand, operating between 1.5-3%.
- Perth enjoyed an extremely low vacancy rate until the last three years, where it has sharply increased to almost 4%. This may be a reflection of the changing economy in Western Australia through the mining conditions.
Summary
When looking into a specific property, it is vital that the vacancy rate of the specific suburb is considered because a macro (state) level may give misleading info. There is a significant range of rates that is captured within the category of ‘Melbourne’ or ‘Sydney’. For example, as of October 2015, Melbourne showed a vacancy rate 2.4%, however looking at more detailed date we can learn that assuming all Melbourne will have low vacancy is incorrect. Melbourne CBD has a vacancy rate of 3% and some inner city suburbs even higher such as Docklands (3.4%) or Southbank (5.2%). This is a vastly different story in Melbourne’s suburbs where it consistently tracks much lower such as 0.8% (Carrum Downs) and 1.4% (Croydon).