One of the benefits of property is that the investor may not have to significantly reduce their current lifestyle to fund the investment. Based on how the property is financed or ‘geared’, the investor may input little or no personal cash week-to-week, as there are multiple sources of income at play. Unlike all other forms of investment, your tenants and the taxman will be paying a large portion of costs involved in servicing the property.
INCOME AND EXPENSES
Like any business, there are income and expenses associated with owning an investment property. There’s quite a few to take into consideration, and they all combine to work out the property’s ‘bottom line’ each year.
INCOME (made up of cash and non-cash)
- rental income
- investor’s personal cash
- tax savings (from deductions generated from actual cash expenses)
- tax savings (from deductions generated from non-cash expenses such as building and fittings depreciation)
EXPENSES (made up of cash and non-cash)
- mortgage loan repayments (interest component only)
- council and water rates
- land tax
- insurances (eg: building and landlord)
- Owner’s Corporation fees
- property management fees (including advertising and letting fees)
- maintenance and repairs
- loan costs (eg: bank application)
- conveyancing
- bookkeeping
- building and fittings depreciation
HOW IT WORKS FOR YOU
The table below depicts a typical gearing structure that incorporates the income and expenses associated with a $400,000 example property.
| ANNUAL EXPENSES | Interest repayments | $22,790 |
| Rates (Council + water) | $1,400 | |
| Owners Corporation + Landlord Insurance | $1,350 | |
| Management fees (6.6%) | $1,235 | |
| Maintenance and repairs | $500 | |
| Land tax | $350 | |
| Bookkeeping | $300 | |
| TOTAL CASH EXPENSES | $27,925 | |
| ANNUAL INCOME | Rental income (50 weeks @$375p.w.) | $18,750 |
| = initial cash shortfall (investor contributions) | -$9,175 |
This combination of income and expenses results in a cash shortfall of $9,175, which would be considered a deduction against your taxable income. However, we also have another NON-CASH expenses to take into consider: depreciation. This hidden deduction is made up of 2.5% building depreciation + 20% fittings depreciation, and it’s this an additional expense to the investment property that really draws in the taxman’s benefit. In this example, the depreciation expense is a substantial $12,125 – an additional tax deduction against the holding costs of the property.
* Assumptions: Loan 1: $367,300 (5.5%p.a. 30year 90% LVR interest-only including $7,300 LMI capitalise). Loan 2: $47,070 (5.5%p.a. 30year equity re-draw interest-only for $10% deposit and $7,070 stamp duty). Estimate of depreciation claimable based on typical 3 bedroom + 2 bathroom + single garage, double storey dwelling
HOW DOES IT AFFECT TAX?
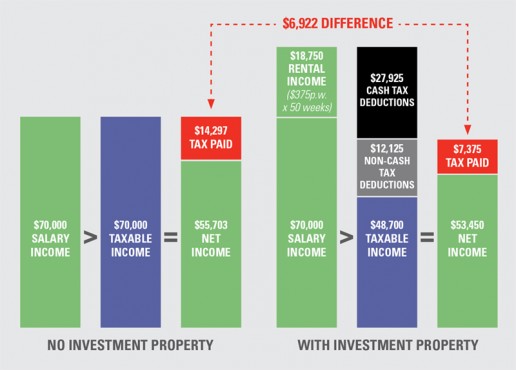
Let’s assume the $400,000 property example is purchased by an investor on a $70,000 annual income. Before investing, the investor would pay $14,297 in tax to the government, resulting in net income of $55,703.
Now, let’s have a look at the affect the investment property has on the investor, as depicted in the bar chart.
Firstly, we need to acknowledge the increase to the investor’s annual income through the rental income received from the tenant. This money is considered income for tax purposes, and inflates the investor’s total earnings for the year to $88,750.
However we know there’s been cash and non-cash expenses associated with running the investment property. The investment-related deductions are introduced against the total taxable income, reducing it to $48,700. This reduces income tax paid to the government to only $7,375, a saving of $6,922 compared with not owning the investment property. These tax savings essentially form a source of ‘income’ that funds the investment, directly contributing to the $9,175 cash shortfall calculated earlier.
NOTE: The minimal drop in net income in the chart represents the final cash input from the investor to pay for the investment. It is the small cash shortfall that must be covered by the investor after all of the rental and taxman incomes have been included.
SUMMARY
Let’s have a look at the final breakdown and cost per week to investor. We’ve been able to use rental income and legal tax savings to fund the large majority of the investment, reducing net out of pocket expense to just over $43 per week!
| ANNUAL EXPENSES | Interest repayments | $22,790 |
| Rates (Council + water) | $1,400 | |
| Owners Corporation + Landlord Insurance | $1,350 | |
| Management fees (6.6%) | $1,235 | |
| Maintenance and repairs | $500 | |
| Land tax | $350 | |
| Bookkeeping | $300 | |
| TOTAL CASH EXPENSES | $27,925 | |
| ANNUAL INCOME | Rental income (50 weeks @$375p.w.) | $18,750 |
| = initial cash shortfall (investor contributions) | -$9,175 | |
| ANNUAL TAX DEPRECIATION | 2.5% building depreciation + 20% fittings depreciation | $12,125 |
| add in annual tax savings (based on $70,000 salary) | $6,922 | |
| = investor’s annual shortfall contribution | $2,253 | |
| = weekly ‘out of pocket’ expense | $43.30 |
Want more? Find out who actually pays
Continue reading